Complemento de Interpolação
O Complemento de Interpolação pode ser utilizado para gerar uma interpolação TIN ou IDW de uma camada de vetores de pontos. É muito simples de lidar e fornece uma interface gráfica de usuário intuitiva para criar camadas raster interpoladas. (See Figure_interpolation_1). O complemento requer a especificação dos seguintes parâmetros antes de ser executado:
- Input vector layer: Specify the input point vector layer(s) from a list of
loaded point layers. If several layers are specified, then data from all layers
is used for interpolation. Note: It is possible to insert lines or polygons as
constraints for the triangulation, by specifying either “points”, “structure
lines” or “break lines” in the Type
 combobox.
 Atributos da interpolação: Selecione uma coluna de atributo para ser usada na interpolação ou habilite a opção
 Usar Coordenada-Z para usar os valores de Z armazenados nas camadas.
- Interpolation Method: Select interpolation method. This can be either ‘Triangulated Irregular Network (TIN)’ or ‘Inverse Distance Weighted (IDW)’.
Número de colunas/linhas: Define o número de linhas e colunas do arquivo raster de saida.
Arquivo de Saída: Define o nome do arquivo raster de saída.
Figure Interpolation 1:
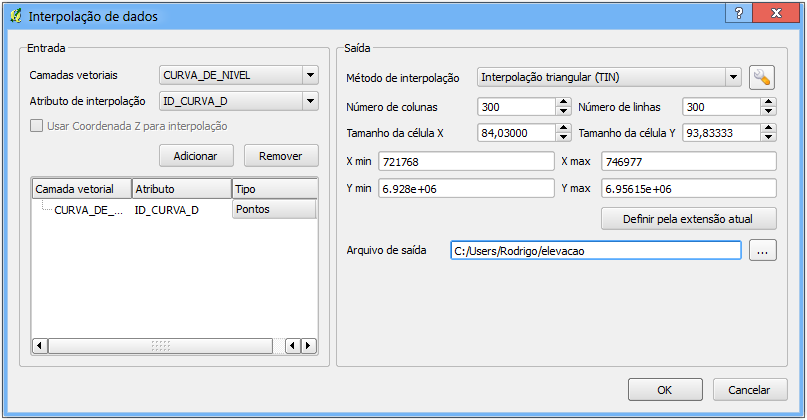
Interpolation Plugin 
Using the plugin
Inicie o QGIS e carregue uma camada de vetor de pontos (p. ex., elevp.csv).
- Load the Interpolation plugin in the Plugin Manager (see Section
Carregar um complemento interno) and click on the
 Interpolation
icon which appears in the QGIS toolbar menu. The Interpolation plugin dialog
appears as shown in Figure_interpolation_1.
Interpolation
icon which appears in the QGIS toolbar menu. The Interpolation plugin dialog
appears as shown in Figure_interpolation_1. Selecione uma camada de entrada (p. ex., elevp’ |selectstring|) e a coluna (p. ex., ``ELEV`) para interpolação.
- Select an interpolation method (e.g. ‘Triangulated Irregular Network (TIN)’), and specify a cellsize of 5000 as well as the raster output filename (e.g., elevation_tin).
Clique [OK].
- For the current example, double click elevation_tin in the layer list
to open the raster Layer Properties dialog and select ‘Pseudocolor’
as Color Map in the Symbology tab. Or
you can define a new color table as described in section Trabalhando com dados Raster.