Base class for 2-dimensional plot/chart/graphs with an X and Y axes. More...
#include <qgsplot.h>
Public Member Functions | |
| Qgs2DXyPlot () | |
| Constructor for Qgs2DXyPlot. | |
| Qgs2DXyPlot (const Qgs2DXyPlot &other)=delete | |
| ~Qgs2DXyPlot () override | |
| void | calculateOptimisedIntervals (QgsRenderContext &context, QgsPlotRenderContext &plotContext) |
| Automatically sets the grid and label intervals to optimal values for display in the given render context. | |
| QgsFillSymbol * | chartBackgroundSymbol () |
| Returns the fill symbol used to render the background of the chart. | |
| const QgsFillSymbol * | chartBackgroundSymbol () const |
| Returns the fill symbol used to render the background of the chart. | |
| QgsFillSymbol * | chartBorderSymbol () |
| Returns the symbol used to render the border of the chart. | |
| const QgsFillSymbol * | chartBorderSymbol () const |
| Returns the symbol used to render the border of the chart. | |
| void | copyCommonProperties (const Qgs2DXyPlot *other) |
| Copies all Qgs2DXyPlot-level properties (axis ranges, axes, flip state, background and border symbols) from other to this plot. | |
| bool | flipAxes () const |
| Returns whether the X and Y axes are flipped. | |
| QRectF | interiorPlotArea (QgsRenderContext &context, QgsPlotRenderContext &plotContext, const QgsPlotData &plotData=QgsPlotData()) const override |
| Returns the area of the plot which corresponds to the actual plot content (excluding all titles and other components which sit outside the plot area). | |
| Qgs2DXyPlot & | operator= (const Qgs2DXyPlot &other)=delete |
| bool | readXml (const QDomElement &element, const QgsReadWriteContext &context) override |
| Reads the plot's properties from an XML element. | |
| void | render (QgsRenderContext &context, QgsPlotRenderContext &plotContext, const QgsPlotData &plotData=QgsPlotData()) override |
| Renders the plot. | |
| void | setChartBackgroundSymbol (QgsFillSymbol *symbol) |
| Sets the fill symbol used to render the background of the chart. | |
| void | setChartBorderSymbol (QgsFillSymbol *symbol) |
| Sets the symbol used to render the border of the chart. | |
| void | setFlipAxes (bool flipAxes) |
| Sets whether the X and Y axes are flipped. | |
| void | setXMaximum (double maximum) |
| Sets the maximum value of the x axis. | |
| void | setXMinimum (double minimum) |
| Sets the minimum value of the x axis. | |
| void | setYMaximum (double maximum) |
| Sets the maximum value of the y axis. | |
| void | setYMinimum (double minimum) |
| Sets the minimum value of the y axis. | |
| bool | writeXml (QDomElement &element, QDomDocument &document, const QgsReadWriteContext &context) const override |
| Writes the plot's properties into an XML element. | |
| QgsPlotAxis & | xAxis () |
| Returns a reference to the plot's x axis. | |
| const QgsPlotAxis & | xAxis () const |
| Returns a reference to the plot's x axis. | |
| double | xMaximum () const |
| Returns the maximum value of the x axis. | |
| double | xMinimum () const |
| Returns the minimum value of the x axis. | |
| QgsPlotAxis & | yAxis () |
| Returns a reference to the plot's y axis. | |
| const QgsPlotAxis & | yAxis () const |
| Returns a reference to the plot's y axis. | |
| double | yMaximum () const |
| Returns the maximum value of the y axis. | |
| double | yMinimum () const |
| Returns the minimum value of the y axis. | |
| Public Member Functions inherited from Qgs2DPlot | |
| Qgs2DPlot () | |
| Constructor for Qgs2DPlot. | |
| Qgs2DPlot (const Qgs2DPlot &other)=delete | |
| ~Qgs2DPlot () override | |
| void | copyCommonProperties (const Qgs2DPlot *other) |
| Copies all Qgs2DPlot-level properties (size, margins, data-defined properties) from other to this plot. | |
| const QgsMargins & | margins () const |
| Returns the margins of the plot area (in millimeters). | |
| Qgs2DPlot & | operator= (const Qgs2DPlot &other)=delete |
| virtual void | renderContent (QgsRenderContext &context, QgsPlotRenderContext &plotContext, const QRectF &plotArea, const QgsPlotData &plotData=QgsPlotData()) |
| Renders the plot content. | |
| void | setMargins (const QgsMargins &margins) |
| Sets the margins of the plot area (in millimeters). | |
| void | setSize (QSizeF size) |
| Sets the overall size of the plot (including titles and over components which sit outside the plot area). | |
| QSizeF | size () const |
| Returns the overall size of the plot (in millimeters) (including titles and other components which sit outside the plot area). | |
| Public Member Functions inherited from QgsPlot | |
| QgsPlot ()=default | |
| virtual | ~QgsPlot () |
| QgsPropertyCollection & | dataDefinedProperties () |
| Returns a reference to the plot's property collection, used for data defined overrides. | |
| const QgsPropertyCollection & | dataDefinedProperties () const |
| Returns a reference to the plot's property collection, used for data defined overrides. | |
| virtual void | initFromPlot (const QgsPlot *plot) |
| Initializes properties of this plot from an existing plot, transferring all applicable settings. | |
| void | setDataDefinedProperties (const QgsPropertyCollection &collection) |
| Sets the plot's property collection, used for data defined overrides. | |
| void | setDataDefinedProperty (DataDefinedProperty key, const QgsProperty &property) |
| Sets a data defined property for the plot. | |
| virtual QString | type () const |
| Returns the plot's type. | |
Protected Member Functions | |
| void | applyDataDefinedProperties (QgsRenderContext &context, double &minX, double &maxX, double &minY, double &maxY, double &majorIntervalX, double &minorIntervalX, double &labelIntervalX, double &majorIntervalY, double &minorIntervalY, double &labelIntervalY) const |
| Applies 2D XY plot data-defined properties. | |
| Protected Member Functions inherited from Qgs2DPlot | |
| void | applyDataDefinedProperties (QgsRenderContext &context, QgsMargins &margins) const |
| Applies 2D plot data-defined properties. | |
Additional Inherited Members | |
| Public Types inherited from QgsPlot | |
| enum class | DataDefinedProperty : int { MarginLeft , MarginTop , MarginRight , MarginBottom , XAxisMajorInterval , XAxisMinorInterval , XAxisLabelInterval , YAxisMajorInterval , YAxisMinorInterval , YAxisLabelInterval , XAxisMinimum , XAxisMaximum , YAxisMinimum , YAxisMaximum } |
| Data defined properties for different plot types. More... | |
| Static Public Member Functions inherited from QgsPlot | |
| static const QgsPropertiesDefinition & | propertyDefinitions () |
| Returns the plot property definitions. | |
| Protected Attributes inherited from QgsPlot | |
| QgsPropertyCollection | mDataDefinedProperties |
Detailed Description
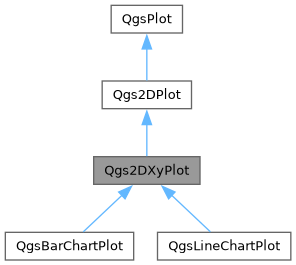
Base class for 2-dimensional plot/chart/graphs with an X and Y axes.
The base class is responsible for rendering the axis, grid lines and chart area. Subclasses can implement the renderContent() method to render their actual plot content.
- Warning
- This class is not considered stable API, and may change in future!
- Since
- QGIS 3.26
Constructor & Destructor Documentation
◆ Qgs2DXyPlot() [1/2]
| Qgs2DXyPlot::Qgs2DXyPlot | ( | ) |
Constructor for Qgs2DXyPlot.
Definition at line 414 of file qgsplot.cpp.
◆ ~Qgs2DXyPlot()
|
overridedefault |
◆ Qgs2DXyPlot() [2/2]
|
delete |
Member Function Documentation
◆ applyDataDefinedProperties()
|
protected |
Applies 2D XY plot data-defined properties.
Definition at line 1229 of file qgsplot.cpp.
◆ calculateOptimisedIntervals()
| void Qgs2DXyPlot::calculateOptimisedIntervals | ( | QgsRenderContext & | context, |
| QgsPlotRenderContext & | plotContext ) |
Automatically sets the grid and label intervals to optimal values for display in the given render context.
Intervals will be calculated in order to avoid overlapping axis labels and to ensure round values are shown.
Definition at line 1042 of file qgsplot.cpp.
◆ chartBackgroundSymbol() [1/2]
| QgsFillSymbol * Qgs2DXyPlot::chartBackgroundSymbol | ( | ) |
Returns the fill symbol used to render the background of the chart.
- See also
- setChartBackgroundSymbol()
Definition at line 1194 of file qgsplot.cpp.
◆ chartBackgroundSymbol() [2/2]
| const QgsFillSymbol * Qgs2DXyPlot::chartBackgroundSymbol | ( | ) | const |
Returns the fill symbol used to render the background of the chart.
- See also
- setChartBackgroundSymbol()
- Note
- not available in Python bindings
Definition at line 1199 of file qgsplot.cpp.
◆ chartBorderSymbol() [1/2]
| QgsFillSymbol * Qgs2DXyPlot::chartBorderSymbol | ( | ) |
Returns the symbol used to render the border of the chart.
- See also
- setChartBorderSymbol()
Definition at line 1209 of file qgsplot.cpp.
◆ chartBorderSymbol() [2/2]
| const QgsFillSymbol * Qgs2DXyPlot::chartBorderSymbol | ( | ) | const |
Returns the symbol used to render the border of the chart.
- See also
- setChartBorderSymbol()
- Note
- not available in Python bindings
Definition at line 1214 of file qgsplot.cpp.
◆ copyCommonProperties()
| void Qgs2DXyPlot::copyCommonProperties | ( | const Qgs2DXyPlot * | other | ) |
Copies all Qgs2DXyPlot-level properties (axis ranges, axes, flip state, background and border symbols) from other to this plot.
- Since
- QGIS 4.0
Definition at line 1350 of file qgsplot.cpp.
◆ flipAxes()
|
inline |
◆ interiorPlotArea()
|
overridevirtual |
Returns the area of the plot which corresponds to the actual plot content (excluding all titles and other components which sit outside the plot area).
Reimplemented from Qgs2DPlot.
Definition at line 871 of file qgsplot.cpp.
◆ operator=()
|
delete |
◆ readXml()
|
overridevirtual |
Reads the plot's properties from an XML element.
Reimplemented from Qgs2DPlot.
Reimplemented in QgsBarChartPlot, and QgsLineChartPlot.
Definition at line 450 of file qgsplot.cpp.
◆ render()
|
overridevirtual |
◆ setChartBackgroundSymbol()
| void Qgs2DXyPlot::setChartBackgroundSymbol | ( | QgsFillSymbol * | symbol | ) |
Sets the fill symbol used to render the background of the chart.
Ownership of symbol is transferred to the plot.
- See also
- chartBackgroundSymbol()
Definition at line 1204 of file qgsplot.cpp.
◆ setChartBorderSymbol()
| void Qgs2DXyPlot::setChartBorderSymbol | ( | QgsFillSymbol * | symbol | ) |
Sets the symbol used to render the border of the chart.
Ownership of symbol is transferred to the plot.
- See also
- chartBorderSymbol()
Definition at line 1219 of file qgsplot.cpp.
◆ setFlipAxes()
| void Qgs2DXyPlot::setFlipAxes | ( | bool | flipAxes | ) |
Sets whether the X and Y axes are flipped.
Definition at line 1224 of file qgsplot.cpp.
◆ setXMaximum()
|
inline |
◆ setXMinimum()
|
inline |
◆ setYMaximum()
|
inline |
◆ setYMinimum()
|
inline |
◆ writeXml()
|
overridevirtual |
Writes the plot's properties into an XML element.
Reimplemented from Qgs2DPlot.
Reimplemented in QgsBarChartPlot, and QgsLineChartPlot.
Definition at line 422 of file qgsplot.cpp.
◆ xAxis() [1/2]
|
inline |
◆ xAxis() [2/2]
|
inline |
◆ xMaximum()
|
inline |
Returns the maximum value of the x axis.
- See also
- setXMaximum()
◆ xMinimum()
|
inline |
Returns the minimum value of the x axis.
- See also
- setXMinimum()
◆ yAxis() [1/2]
|
inline |
◆ yAxis() [2/2]
|
inline |
◆ yMaximum()
|
inline |
Returns the maximum value of the y axis.
- See also
- setYMaximum()
◆ yMinimum()
|
inline |
Returns the minimum value of the y axis.
- See also
- setYMinimum()
The documentation for this class was generated from the following files:
- /build/qgis-4.0.0+99sid/src/core/plot/qgsplot.h
- /build/qgis-4.0.0+99sid/src/core/plot/qgsplot.cpp
Generated on for QGIS API Documentation by