.
Peralatan Umum
Shortcut Papanketik
QGIS provides default keyboard shortcuts for many features. You can find them in section Bar Menu. Additionally, the menu option Settings ‣ Configure Shortcuts.. allows you to change the default keyboard shortcuts and to add new keyboard shortcuts to QGIS features.
Figure Shortcuts 1:
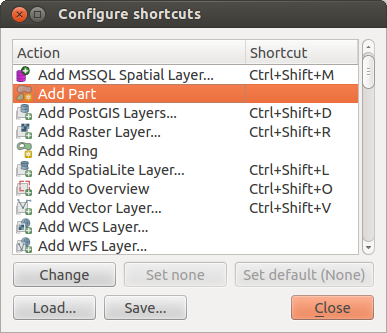
Define shortcut options  (Gnome)
Configuration is very simple. Just select a feature from the list and click on [Change], [Set none] or [Set default]. Once you have finished your configuration, you can save it as an XML file and load it to another QGIS installation.
Konteks Bantuan
Saat Anda membutuhkan bantuan dengan topik yang spesifik, Anda dapat mengakses konteks bantuan melalui tombol [Bantuan] tersedia disebagian besar dialog - harap dicatat bahwa plugin pihak ketiga dapat mengarah ke halaman web khusus.
Rendering
By default, QGIS renders all visible layers whenever the map canvas is refreshed. The events that trigger a refresh of the map canvas include:
Menambahkan lapisan (layer)
Menggeser atau memperbesar
- Resizing the QGIS window
Merubah visitabilitas dari lapisan (layer)
QGIS allows you to control the rendering process in a number of ways.
Scale Dependent Rendering
Skala render memungkinkan Anda untuk menentukan skaa minimum dan skala maksimum di mana lapisan akan terlihat. Untuk mengatur skala render bergantung, buka dialog Properti dengan mengklik-dobel pada lapisan di legenda. Pada tab Umum klik pada kotak centang  Skala bergantung pada visibilitas untuk mengaktifkan fitur, kemudian atur nilai maskimum dan minimum skala.
You can determine the scale values by first zooming to the level you want to use and noting the scale value in the QGIS status bar.
Mengontrol Rendering Peta
Map rendering can be controlled in the various ways, as described below.
Menunda Rendering
To suspend rendering, click the Render checkbox in the
lower right corner of the status bar. When the Render
checkbox is not checked, QGIS does not redraw the canvas in response to any of
the events described in section Rendering. Examples of when you
might want to suspend rendering include:
Menambah banyak lapisan dan melambangkan mereka sebelum menggambar
Menambahkan satu atau lebih lapisan besar dan mengatur ketergantungan skala sebelum menggambar
Menambahkan satu atau lebih lapisan besar dan perbesar ke tampilan spesifik sebelum menggambar
Kombinasi dari yang ada di atas
Aktifkan kotak centang Render mengaktifkan rendering dan dan menyebabkan refresh langsung dari kanvas peta.
Pengaturan Lapisan Tambah Opsi
Anda dapat mengatur pilihan untuk selalu memuat lapisan baru tanpa menggambar mereka. Ini berarti lapisan akan ditambahkan ke peta, namun visibilitas kotak centang dalam legenda akan dicentang secara default. Untuk mengatur opsi ini, pilih menu opsi Pengaturan ‣ Opsi dan klik tab Rendering. Hapus centang Secara standar lapisan baru ditambahkan ke peta selalu ditampilkan. Setiap lapisan ditambahkan ke peta akan tidak terlihat secara standar.
Menghentikan Rendering
Untuk menghentikan penggambaran peta, tekan tombol ESC. Ini akan menghentikan refresh kanvas peta dan menghentikan proses penggambaran peta. Hal ini mungkin membutuhkan waktu selama menekan ESC dan penggambaran peta terhenti.
Catatan
Saat ini tidak memungkikan untuk menghentikan rendering - ini dinonaktifkan di port qt4 karena masalah antarmuka pengguna (UI) dan konflik (crash).
Updating the Map Display During Rendering
You can set an option to update the map display as features are drawn. By default, QGIS does not display any features for a layer until the entire layer has been rendered. To update the display as features are read from the datastore, choose menu option Settings ‣ Options and click on the Rendering tab. Set the feature count to an appropriate value to update the display during rendering. Setting a value of 0 disables update during drawing (this is the default). Setting a value too low will result in poor performance, as the map canvas is continually updated during the reading of the features. A suggested value to start with is 500.
Mempengarui Kualitas Rendering
To influence the rendering quality of the map, you have two options. Choose menu option Settings ‣ Options, click on the Rendering tab and select or deselect following checkboxes:
- Make lines appear less jagged at the expense of some
drawing performance
- Fix problems with incorrectly filled polygons
Mempercepat rendering
There are two settings that allow you to improve rendering speed. Open the QGIS options dialog using Settings ‣ Options, go to the Rendering tab and select or deselect the following checkboxes:
- Enable back buffer. This provides better graphics
performance at the cost of losing the possibility to cancel rendering and
incrementally draw features. If it is unchecked, you can set the
Number of features to draw before updating the display, otherwise
this option is inactive.
- Gunakan render caching yang memungkinkan mempercepat gambar ulang
Mengukur
Measuring works within projected coordinate systems (e.g., UTM) and unprojected data. If the loaded map is defined with a geographic coordinate system (latitude/longitude), the results from line or area measurements will be incorrect. To fix this, you need to set an appropriate map coordinate system (see section Working with Projections). All measuring modules also use the snapping settings from the digitizing module. This is useful, if you want to measure along lines or areas in vector layers.
To select a measuring tool, click on  and select the tool you want
to use.
and select the tool you want
to use.
Measure length, areas and angles
Measure Line: QGIS is able to measure real distances
between given points according to a defined ellipsoid. To configure this,
choose menu option Settings ‣ Options, click on the
Map tools tab and select the appropriate ellipsoid. There, you can
also define a rubberband color and your preferred measurement units (meters or
feet) and angle units (degrees, radians and gon). The tool then allows you to
click points on the map. Each segment length, as well as the total, shows up in
the measure window. To stop measuring, click your right mouse button.
Note that you can interactively change the measurement units in the measurement
dialog. It overrides the Preferred measurement units in the options.
There is an info section in the dialog that shows which CRS settings are being used
during measurement calculations.
Figure Measure 1:
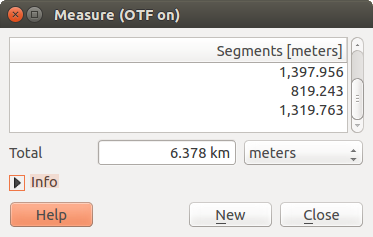
Measure Distance (Gnome)
 Measure Area: Areas can also be measured. In the
measure window, the accumulated area size appears. In addition, the measuring
tool will snap to the currently selected layer, provided that layer has its
snapping tolerance set (see section Setting the Snapping Tolerance and Search Radius). So, if you want
to measure exactly along a line feature, or around a polygon feature, first set
its snapping tolerance, then select the layer. Now, when using the measuring
tools, each mouse click (within the tolerance setting) will snap to that layer.
Measure Area: Areas can also be measured. In the
measure window, the accumulated area size appears. In addition, the measuring
tool will snap to the currently selected layer, provided that layer has its
snapping tolerance set (see section Setting the Snapping Tolerance and Search Radius). So, if you want
to measure exactly along a line feature, or around a polygon feature, first set
its snapping tolerance, then select the layer. Now, when using the measuring
tools, each mouse click (within the tolerance setting) will snap to that layer.
Figure Measure 2:
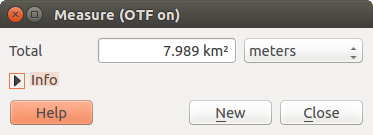
Measure Area (Gnome)
 Measure Angle: You can also measure angles. The
cursor becomes cross-shaped. Click to draw the first segment of the angle you
wish to measure, then move the cursor to draw the desired angle. The measure
is displayed in a pop-up dialog.
Measure Angle: You can also measure angles. The
cursor becomes cross-shaped. Click to draw the first segment of the angle you
wish to measure, then move the cursor to draw the desired angle. The measure
is displayed in a pop-up dialog.
Figure Measure 3:
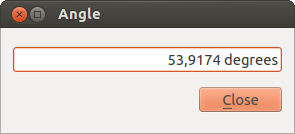
Measure Angle (Gnome)
Pilih dan lepas fitur
The QGIS toolbar provides several tools to select features in the map canvas.
To select one or several features, just click on  and select your
tool:
and select your
tool:
- Select Single Feature
 Select Features by Rectangle
 Select Features by Polygon
 Select Features by Freehand
 Select Features by Radius
To deselect all selected features click on  Deselect
features from all layers.
Deselect
features from all layers.
 Select feature using an expression allow user
to select feature using expression dialog. See Expressions
chapter for some example.
Select feature using an expression allow user
to select feature using expression dialog. See Expressions
chapter for some example.
Users can save features selection into a New Memory Vector Layer or a New Vector Layer using Edit ‣ Paste Feature as ... and choose the mode you want.
Fitur Identifikasi
The Identify tool allows you to interact with the map canvas and get information on features
in a pop-up window. To identify features, use View ‣ Identify
features or press Ctrl + Shift + I, or click on the  Identify features icon in the toolbar.
If you click on several features, the Identify results dialog will list information about all the selected features. The first item is the number of the layer in the list of results, followed by the layer name. Then, its first child will be the name of a field with its value. The first field is the one selected in Properties ‣ Display. Finally, all information about the feature is displayed.
Jendela ini dapat disesuaikan untuk menampilkan kolom kustom namun secara default akan menampilkan tiga jenis informasi:
- Actions: Actions can be added to the identify feature windows. When clicking on the action label, action will be run. By default, only one action is added, to view feature form for editing.
- Derived: This information is calculated or derived from other information. You can find clicked coordinate, X and Y coordinates, area in map units and perimeter in map units for polygons, length in map units for lines and feature ids.
- Data attributes: This is the list of attribute fields from the data.
Figure Identify 1:
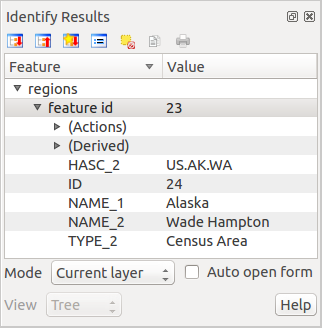
Identify feaures dialog (Gnome)
At the top of the window, you have five icons:
 Expand tree
 Collapse tree
 Default behaviour
 Copy attributes
 Print selected HTML response
At the bottom of the window, you have the Mode and View comboboxes. With the Mode combobox you can define the identify mode: ‘Current layer’, ‘Top down, stop at first’, ‘Top down’ and ‘Layer selection’. The View can be set as ‘Tree’, ‘Table’ and ‘Graph’.
The identify tool allows you to auto open a form. In this mode you can change the feautures attributes.
Fungsi lain dapat ditemukan dalam menu konteks dari ditentukannya item. Sebagai contoh, dari menu konteks Anda dapat:
Lihat form fitur
Perbesar ke fitur
Salin fitur: salin semua fitur geometri dan atribut
- Toggle feature selection: adds identified feature to selection
Salin nilai atribut: hanya menyalin nilai dari atribut yang Anda klik
- Copy feature attributes: Copy only attributes
Bersihkan hasilnya: Hapus hasil di jendela
Bersihkan highlight: Hapus fitur highlight pada peta
Highlight semua
Highlight lapisan
Aktifkan lapisan: Pilih lapisan yang akan diaktifkan
Properti lapisa: buka jendel properti lapisan
Perluas (expand) semua
Runtuh (collapse) semua
Dekorasi
The Decorations of QGIS include the Grid, the Copyright Label, the North Arrow and the Scale Bar. They are used to ‘decorate’ the map by adding cartographic elements.
Kisi (Grid)
 Grid memungkinkan untuk menambahkan koordinat kisi (grid) dan koordinat anotasi untuk kanvas peta.
Figure Decorations 1:
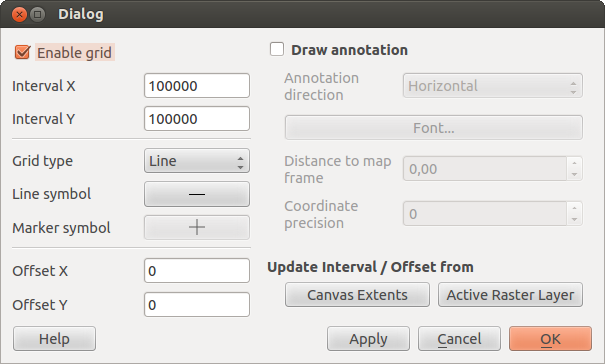
The Grid Dialog
Pilih dari menu Tampilan ‣ Decorasi ‣ Kisi. Mulai dialog (lihat figure_decorations_1).
Aktifkan kotak centang
Aktifkan Kisi dan menetapkan definisi kisi (grid) sesuai dengan lapisan yang dimuat dalam kanvas peta.Aktifkan kotak centang Gambar anotasi dan menetapkan definisi anotasi sesuai dengan lapisan yang dimuat dalam kanvas peta.
- Click [Apply] to verify that it looks as expected.
- Click [OK] to close the dialog.
Label Hak Cipta
 Copyright label adds a copyright label using the text
you prefer to the map.
Copyright label adds a copyright label using the text
you prefer to the map.
Figure Decorations 2:
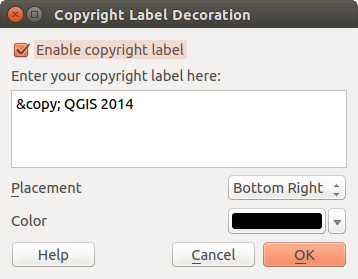
The Copyright Dialog
Pilih dari menu Tampilan ‣ Dekorasi ‣ Label hak Cipta. (lihat figure_decorations_2).
Masukkan teks yang Anda ingin tempatkan di peta. Anda bisa menggunakan HTML seperti dalam contoh
- Choose the placement of the label from the Placement
 combo box.
 Pastikan kotak centang telah ditandai/aktifkan Aktifkan Label Hak Cipta
- Click [OK].
In the example above, which is the default, QGIS places a copyright symbol followed by the date in the lower right-hand corner of the map canvas.
Panah Utara
![]() North Arrow places a simple north arrow on the map canvas.
At present, there is only one style available. You can adjust the angle of the
arrow or let QGIS set the direction automatically. If you choose to let QGIS
determine the direction, it makes its best guess as to how the arrow should be
oriented. For placement of the arrow, you have four options, corresponding to
the four corners of the map canvas.
North Arrow places a simple north arrow on the map canvas.
At present, there is only one style available. You can adjust the angle of the
arrow or let QGIS set the direction automatically. If you choose to let QGIS
determine the direction, it makes its best guess as to how the arrow should be
oriented. For placement of the arrow, you have four options, corresponding to
the four corners of the map canvas.
Figure Decorations 3:
The North Arrow Dialog
Bar Skala
 Scale Bar adds a simple scale bar to the map canvas. You
can control the style and placement, as well as the labeling of the bar.
Scale Bar adds a simple scale bar to the map canvas. You
can control the style and placement, as well as the labeling of the bar.
Figure Decorations 4:
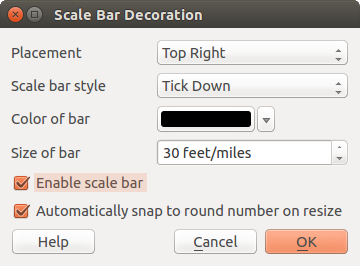
The Scale Bar Dialog
QGIS only supports displaying the scale in the same units as your map frame. So if the units of your layers are in meters, you can’t create a scale bar in feet. Likewise, if you are using decimal degrees, you can’t create a scale bar to display distance in meters.
Menambahkan bar skala:
Pilih dari menu Tampilan ‣ Dekorasi ‣ Skala Bar (lihat figure_decorations_4)
- Choose the placement from the Placement combo box.
- Choose the style from the Scale bar style
combo box.
- Select the color for the bar Color of bar
 or use
the default black color.
or use
the default black color. - Set the size of the bar and its label Size of bar
 .
. Pastikan kotak centang sudah aktif
Aktifkan skala bar- Optionally, check Automatically snap to round number
on resize.
- Click [OK].
Tip
Pengaturan Dekorasi
Saat Anda menyimpan sebuah proyek .qgs, setiap perubahan yang Anda buat pada Kisi (Grid), Panah Utara, Skala Bar dan Hak Cipta akan disimpan dalam proyek dan dikembalikan pada saat Anda memuat proyek.
Peralatan Anotasi
The  Text Annotation tool in the attribute
toolbar provides the possibility to place formatted text in a balloon on the
QGIS map canvas. Use the Text Annotation tool and click into the
map canvas.
Text Annotation tool in the attribute
toolbar provides the possibility to place formatted text in a balloon on the
QGIS map canvas. Use the Text Annotation tool and click into the
map canvas.
Figure annotation 1:
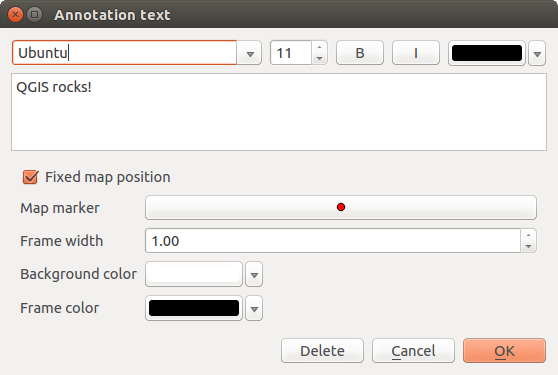
Annotation text dialog
Dobel klik pada item membuka dialog dengan berbagai pilihan. Ada editor teks untuk memasukkan teks yang diformat dan pengaturan item lain. Misalnya ada pilihan memiliki item ditempatkan pada posisi peta (ditampilkan dengan simbol penanda) atau memiliki item pada posisi layar (tidak berhubungan dengan peta). Item ini bisa dipindahkan dengan posisi peta (geser penanda peta) atau hanya dengan memindahkan balon. Ikon adalah bagian dari tema GIS, dan digunakan secara default dalam tema-tema lain juga.
The  Move Annotation tool allows you to move the
annotation on the map canvas.
Move Annotation tool allows you to move the
annotation on the map canvas.
Anotasi HTML
The  Html Annotation tools in the attribute
toolbar provides the possibility to place the content of an html file in a
balloon on the QGIS map canvas. Using the Html Annotation tool, click
into the map canvas and add the path to the html file into the dialog.
Html Annotation tools in the attribute
toolbar provides the possibility to place the content of an html file in a
balloon on the QGIS map canvas. Using the Html Annotation tool, click
into the map canvas and add the path to the html file into the dialog.
Anotasi SVG
The  SVG Annotation tool in the attribute toolbar
provides the possibility to place an SVG symbol in a balloon on the QGIS map
canvas. Using the SVG Annotation tool, click into the map canvas and
add the path to the SVG file into the dialog.
SVG Annotation tool in the attribute toolbar
provides the possibility to place an SVG symbol in a balloon on the QGIS map
canvas. Using the SVG Annotation tool, click into the map canvas and
add the path to the SVG file into the dialog.
Form anotasi
Additionally, you can also create your own annotation forms. The
Form Annotation tool is useful to display
attributes of a vector layer in a customized Qt Designer form (see
figure_custom_annotation). This is similar to the designer forms for the
Identify features tool, but displayed in an annotation item.
Also see this video https://www.youtube.com/watch?v=0pDBuSbQ02o from
Tim Sutton for more information.
Figure annotation 2:
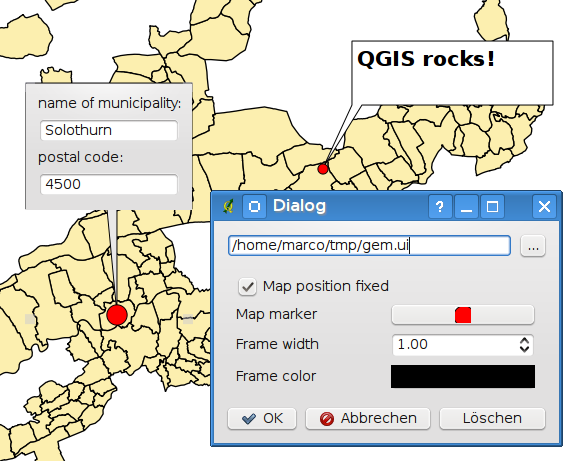
Customized qt designer annotation form
Catatan
Jika Anda menekan Ctrl+T sementara alat Anotasi aktif (anotasi bergerak, anotasi teks, form anotasi), visibilitas item yang terbalik.
Bookmark Spasial
Spatial Bookmarks allow you to “bookmark” a geographic location and return to it later.
Membuat Bookmark
Membuat Bookmark
Perbesar atau geser ke interes area.
- Select the menu option View ‣ New Bookmark or press Ctrl-B.
Masukkan nama deskripsi dari bookmark (batas 255 karakter).
- Press Enter to add the bookmark or [Delete] to remove the bookmark.
Catatan Anda bisa memiliki bookmark banyak dengan satu nama.
Bekerja dengan Bookmark
To use or manage bookmarks, select the menu option View ‣ Show Bookmarks. The Geospatial Bookmarks dialog allows you to zoom to or delete a bookmark. You cannot edit the bookmark name or coordinates.
Zooming to a Bookmark
From the Geospatial Bookmarks dialog, select the desired bookmark by clicking on it, then click [Zoom To]. You can also zoom to a bookmark by double-clicking on it.
Deleting a Bookmark
To delete a bookmark from the Geospatial Bookmarks dialog, click on it, then click [Delete]. Confirm your choice by clicking [Yes], or cancel the delete by clicking [No].
Import or export a bookmark
To share or transfer your bookmarks between computers you can use the Share pull down menu in the Geospatial Bookmarks dialog.
Proyek-proyek Nesting
Jika Anda ingin menanamkan (embed) isi dari berkas proyek lain kedalam proyek Anda, Anda bisa memilih Lapisan ‣ Tanam Lapisan dan Grup.
Menanam (Embedding) lapisan
Dialog berikut memungkinkan Anda menanamkan lapisan dari proyek-proyek lain. Berikut ini adalah contoh kecil:
- Press
 to look for another project from the Alaska dataset.
 - Select the project file grassland. You can see the content of the project (see figure_embed_dialog).
- Press Ctrl and click on the layers grassland and regions. Press [OK]. The selected layers are embedded in the map legend and the map view now.
Figure Nesting 1:
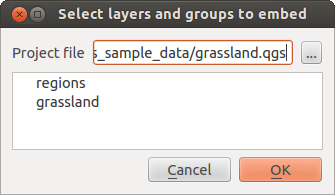
Select layers and groups to embed
Sementara lapisan tertanam dapat diedit, Anda tidak dapat mengubah properti mereka seperti gaya dan pelabelan.
Menghapus lapisan-lapisan ditanam (embdded)
Right-click on the embedded layer and choose  Remove.